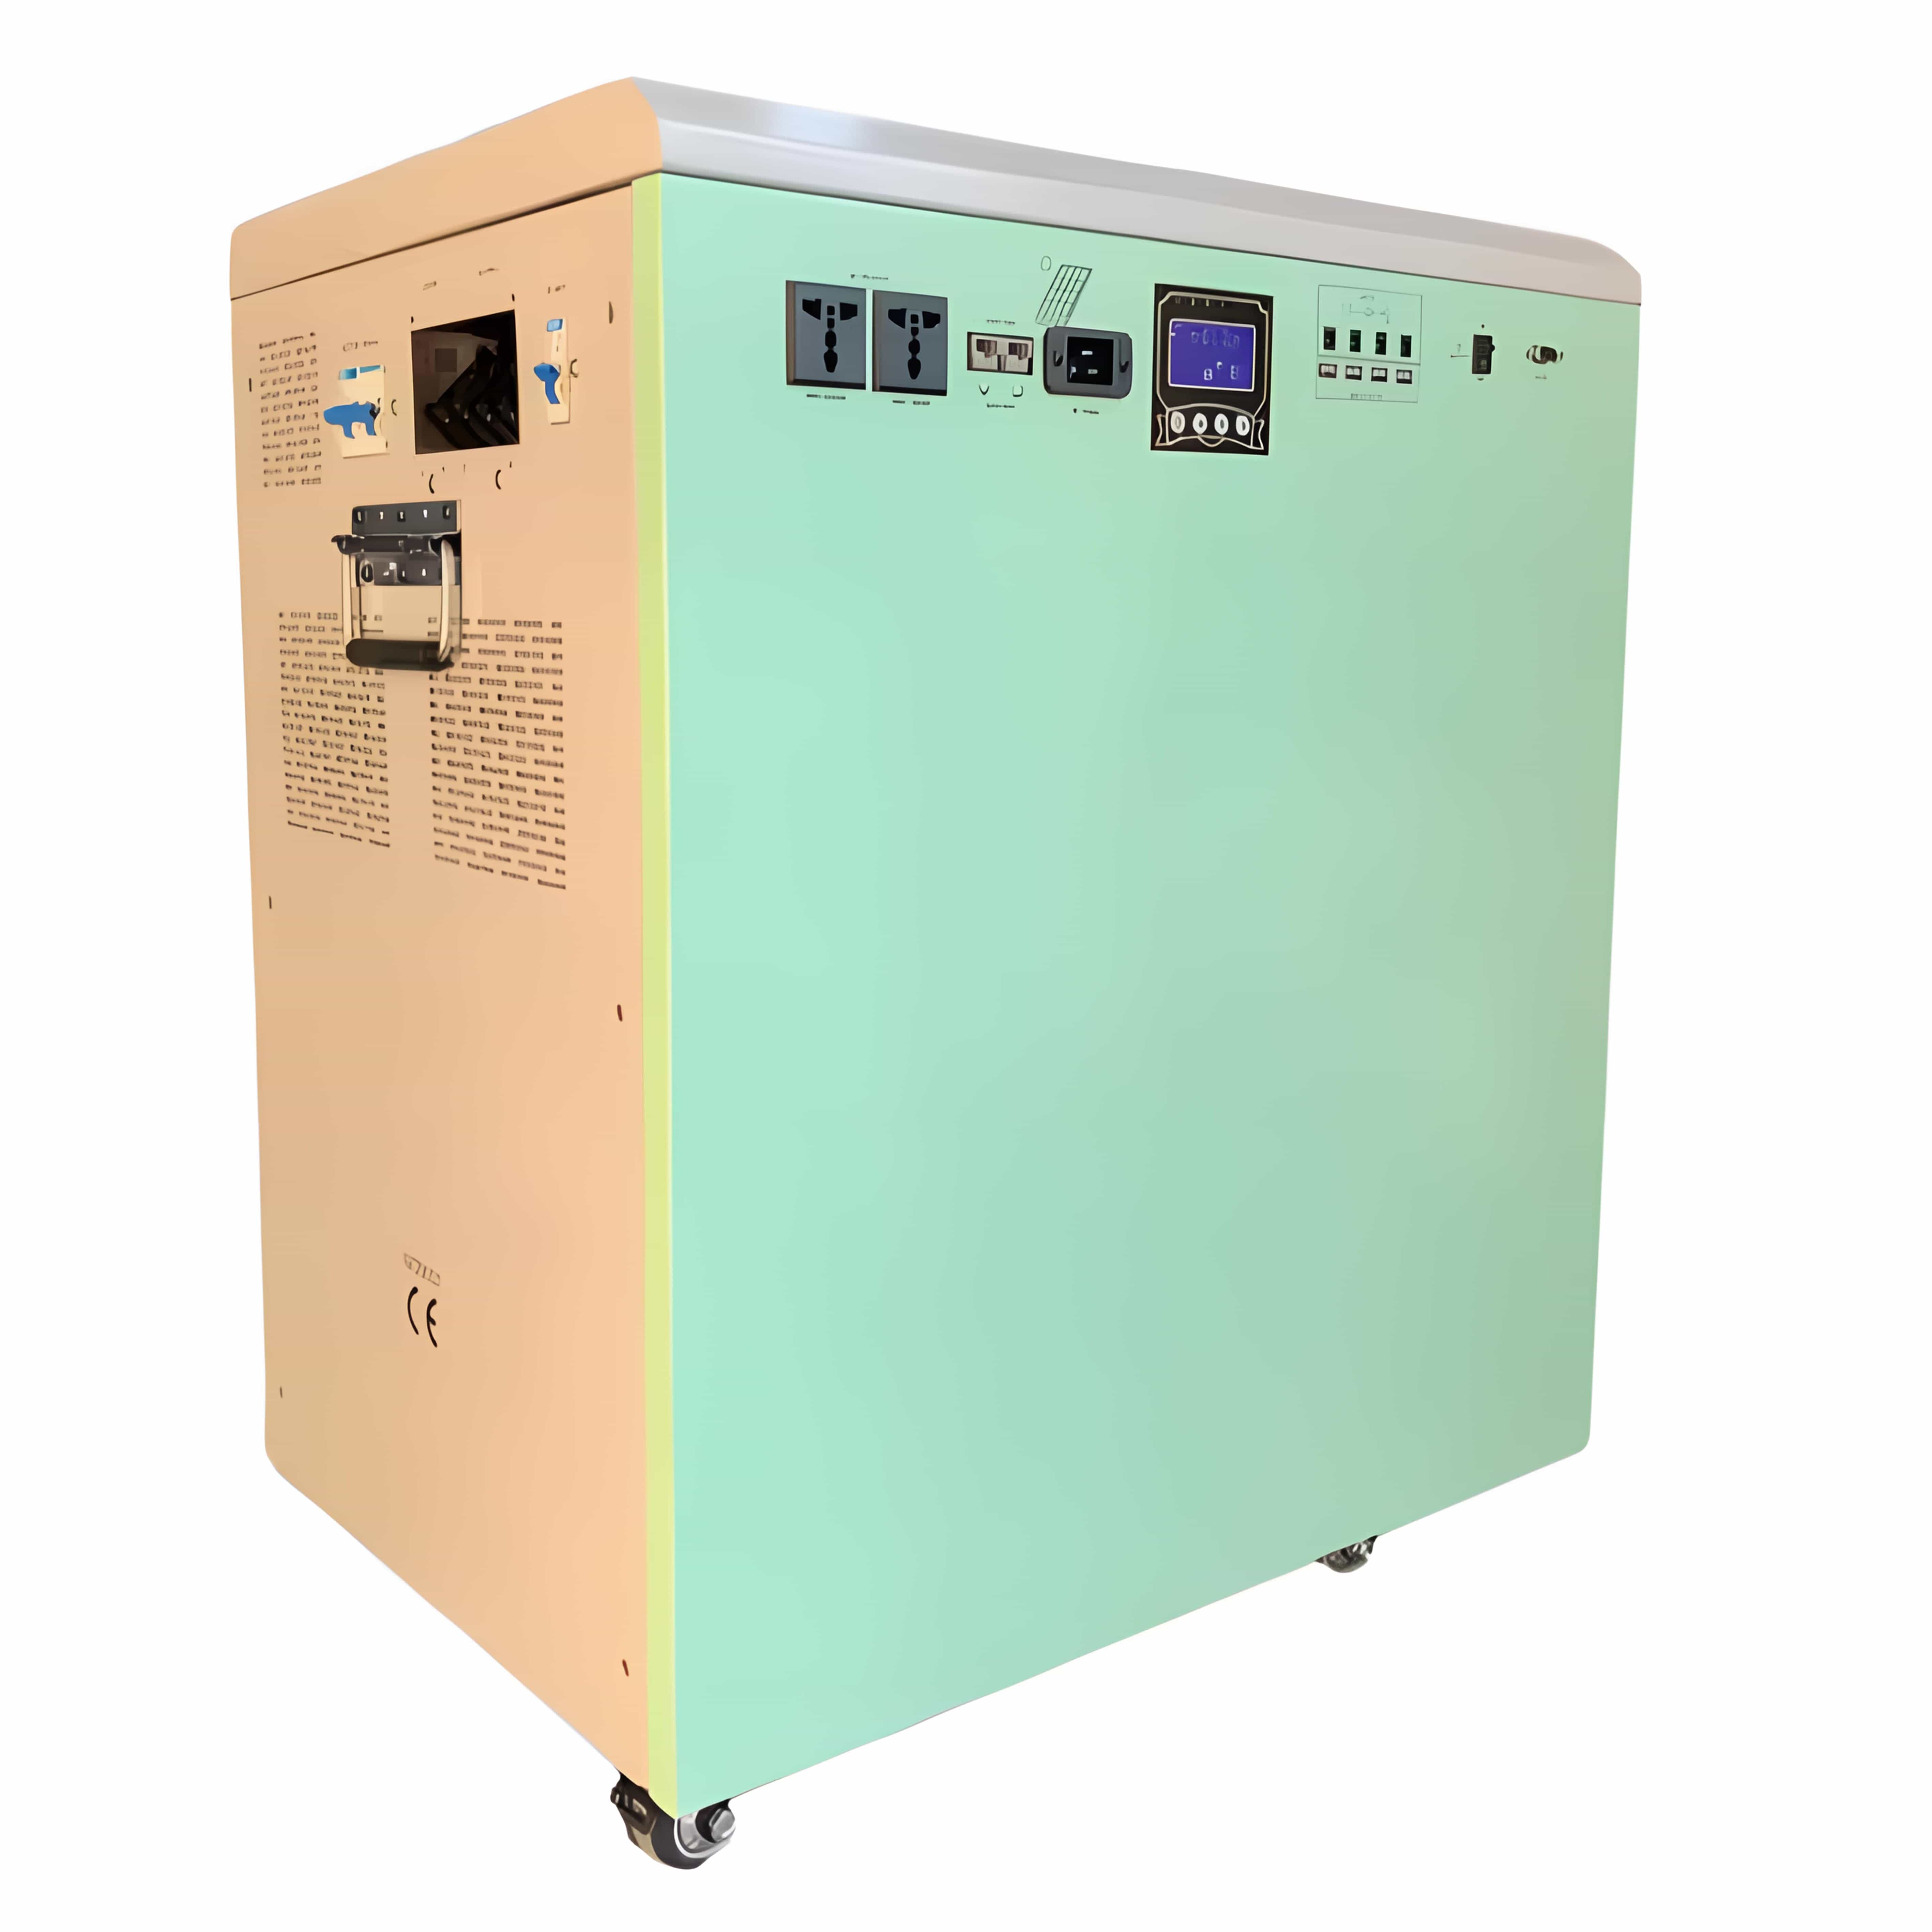
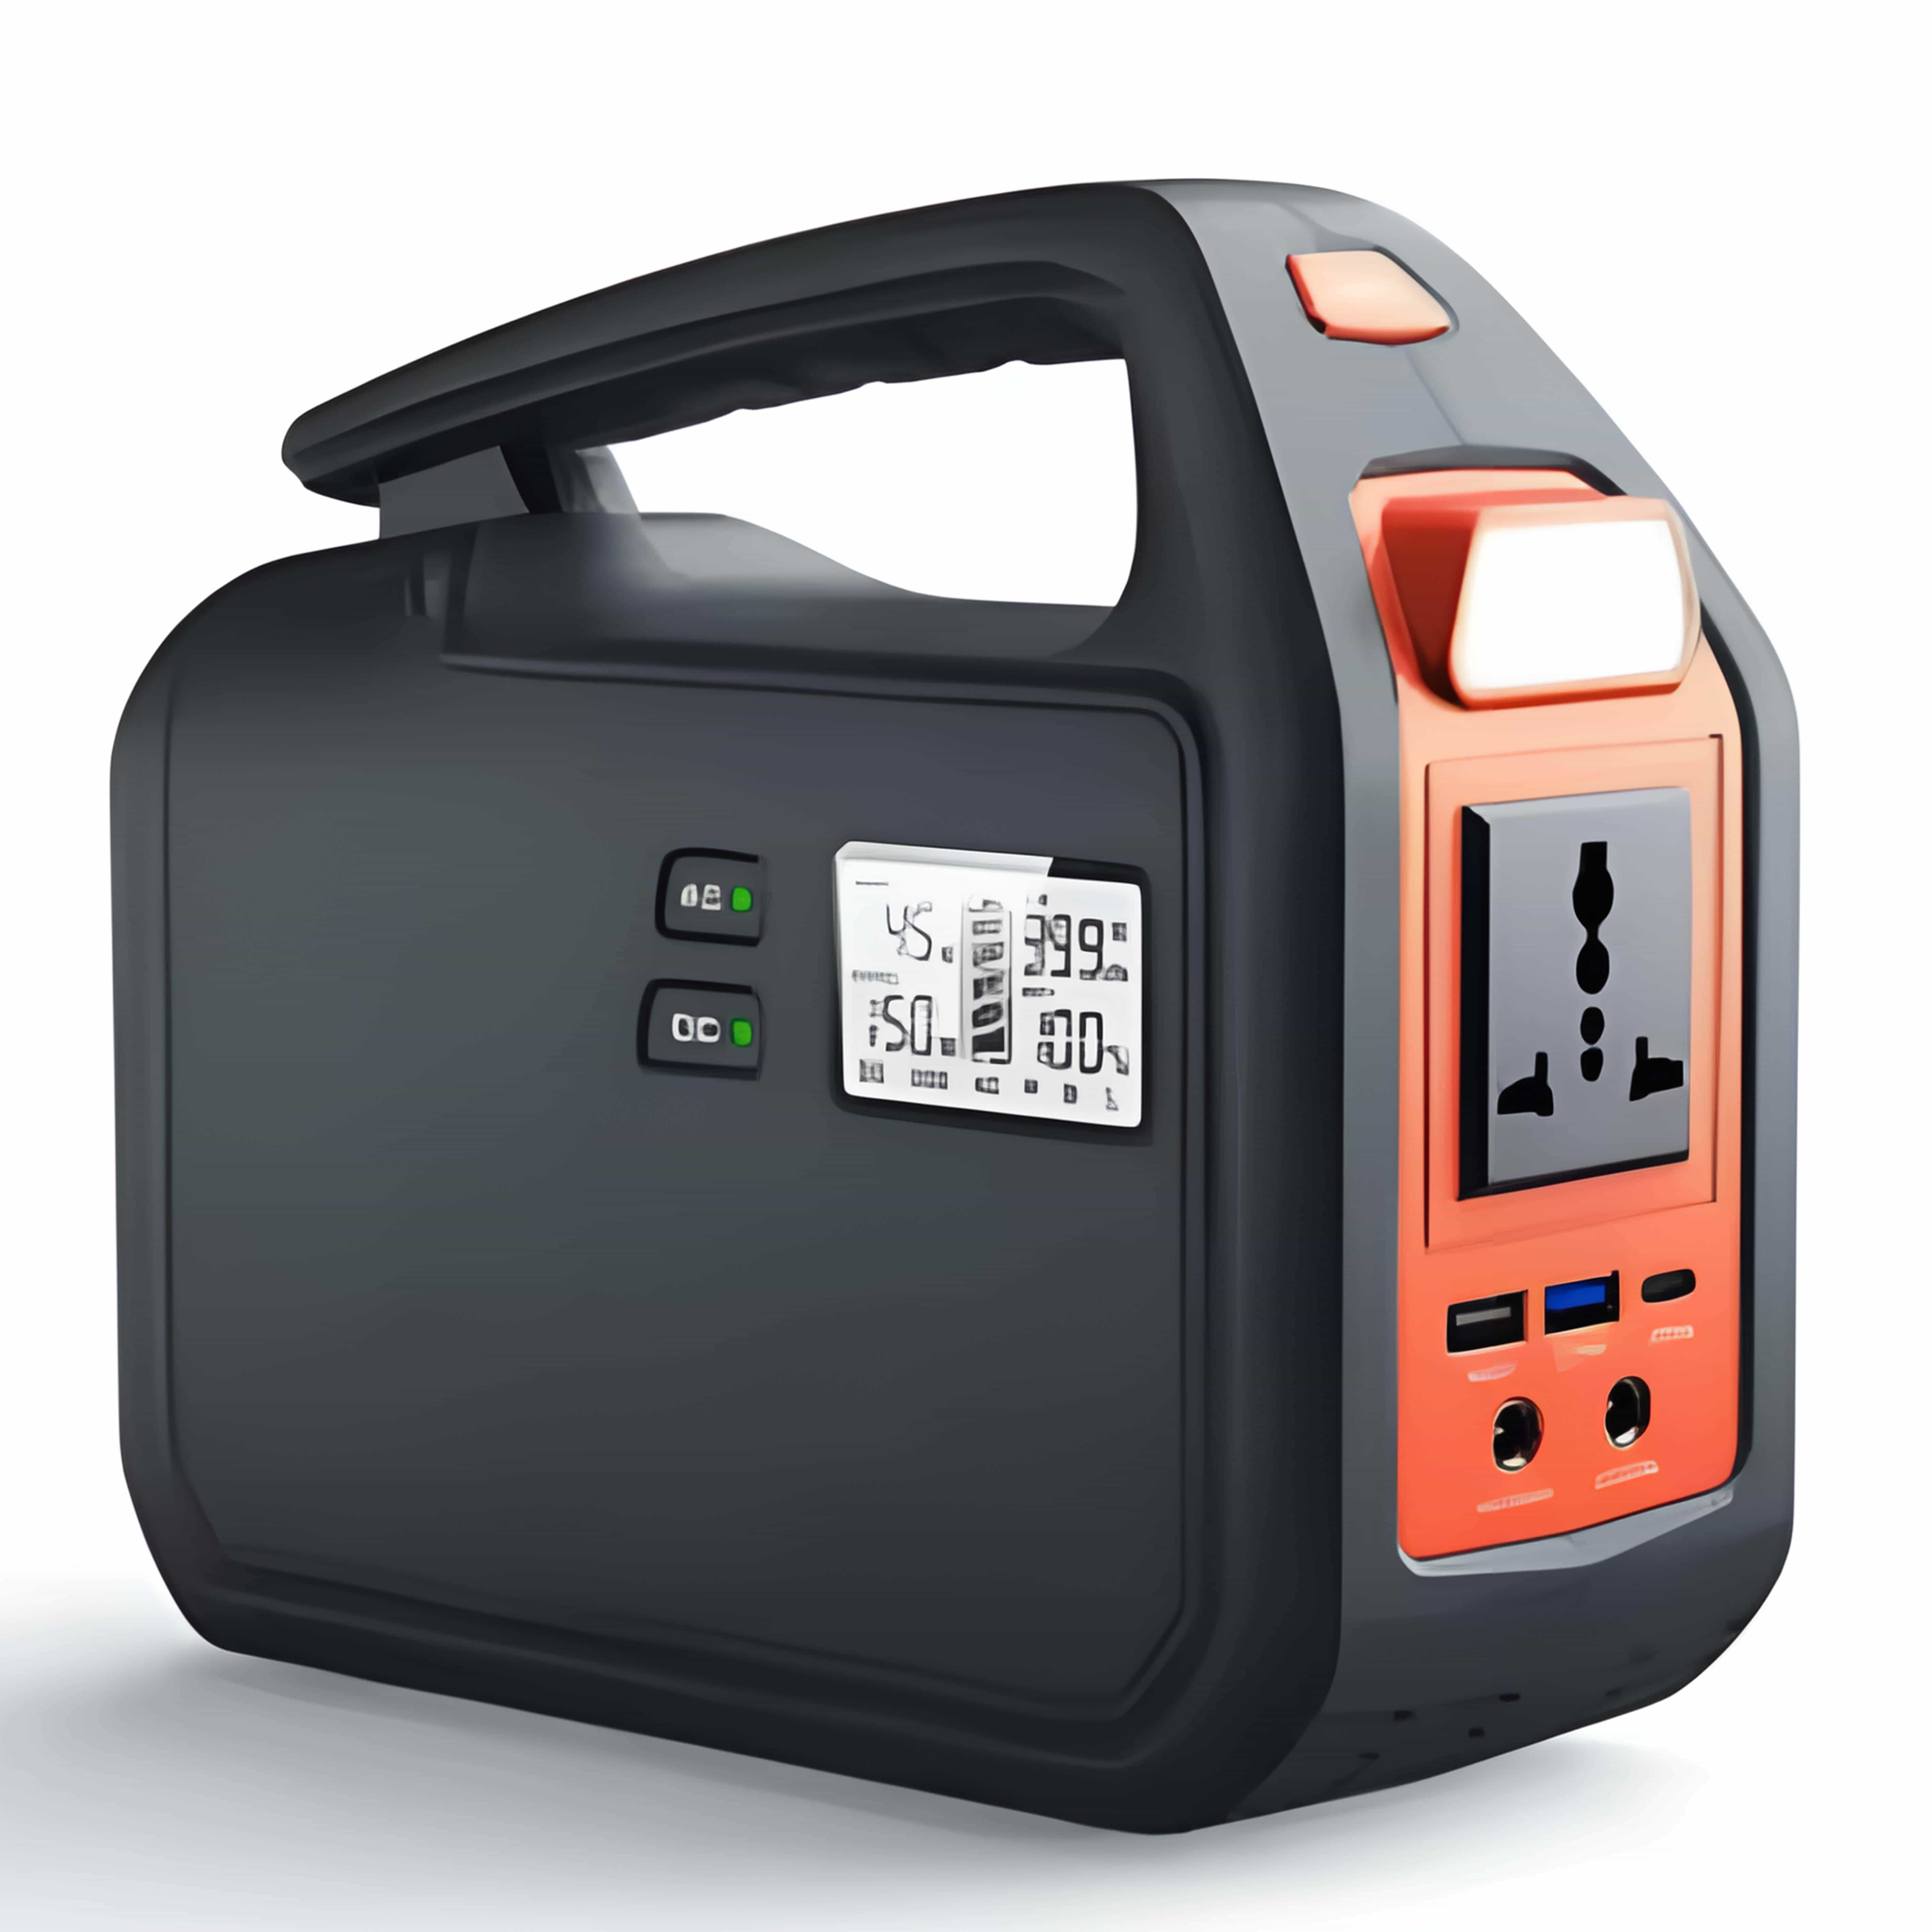
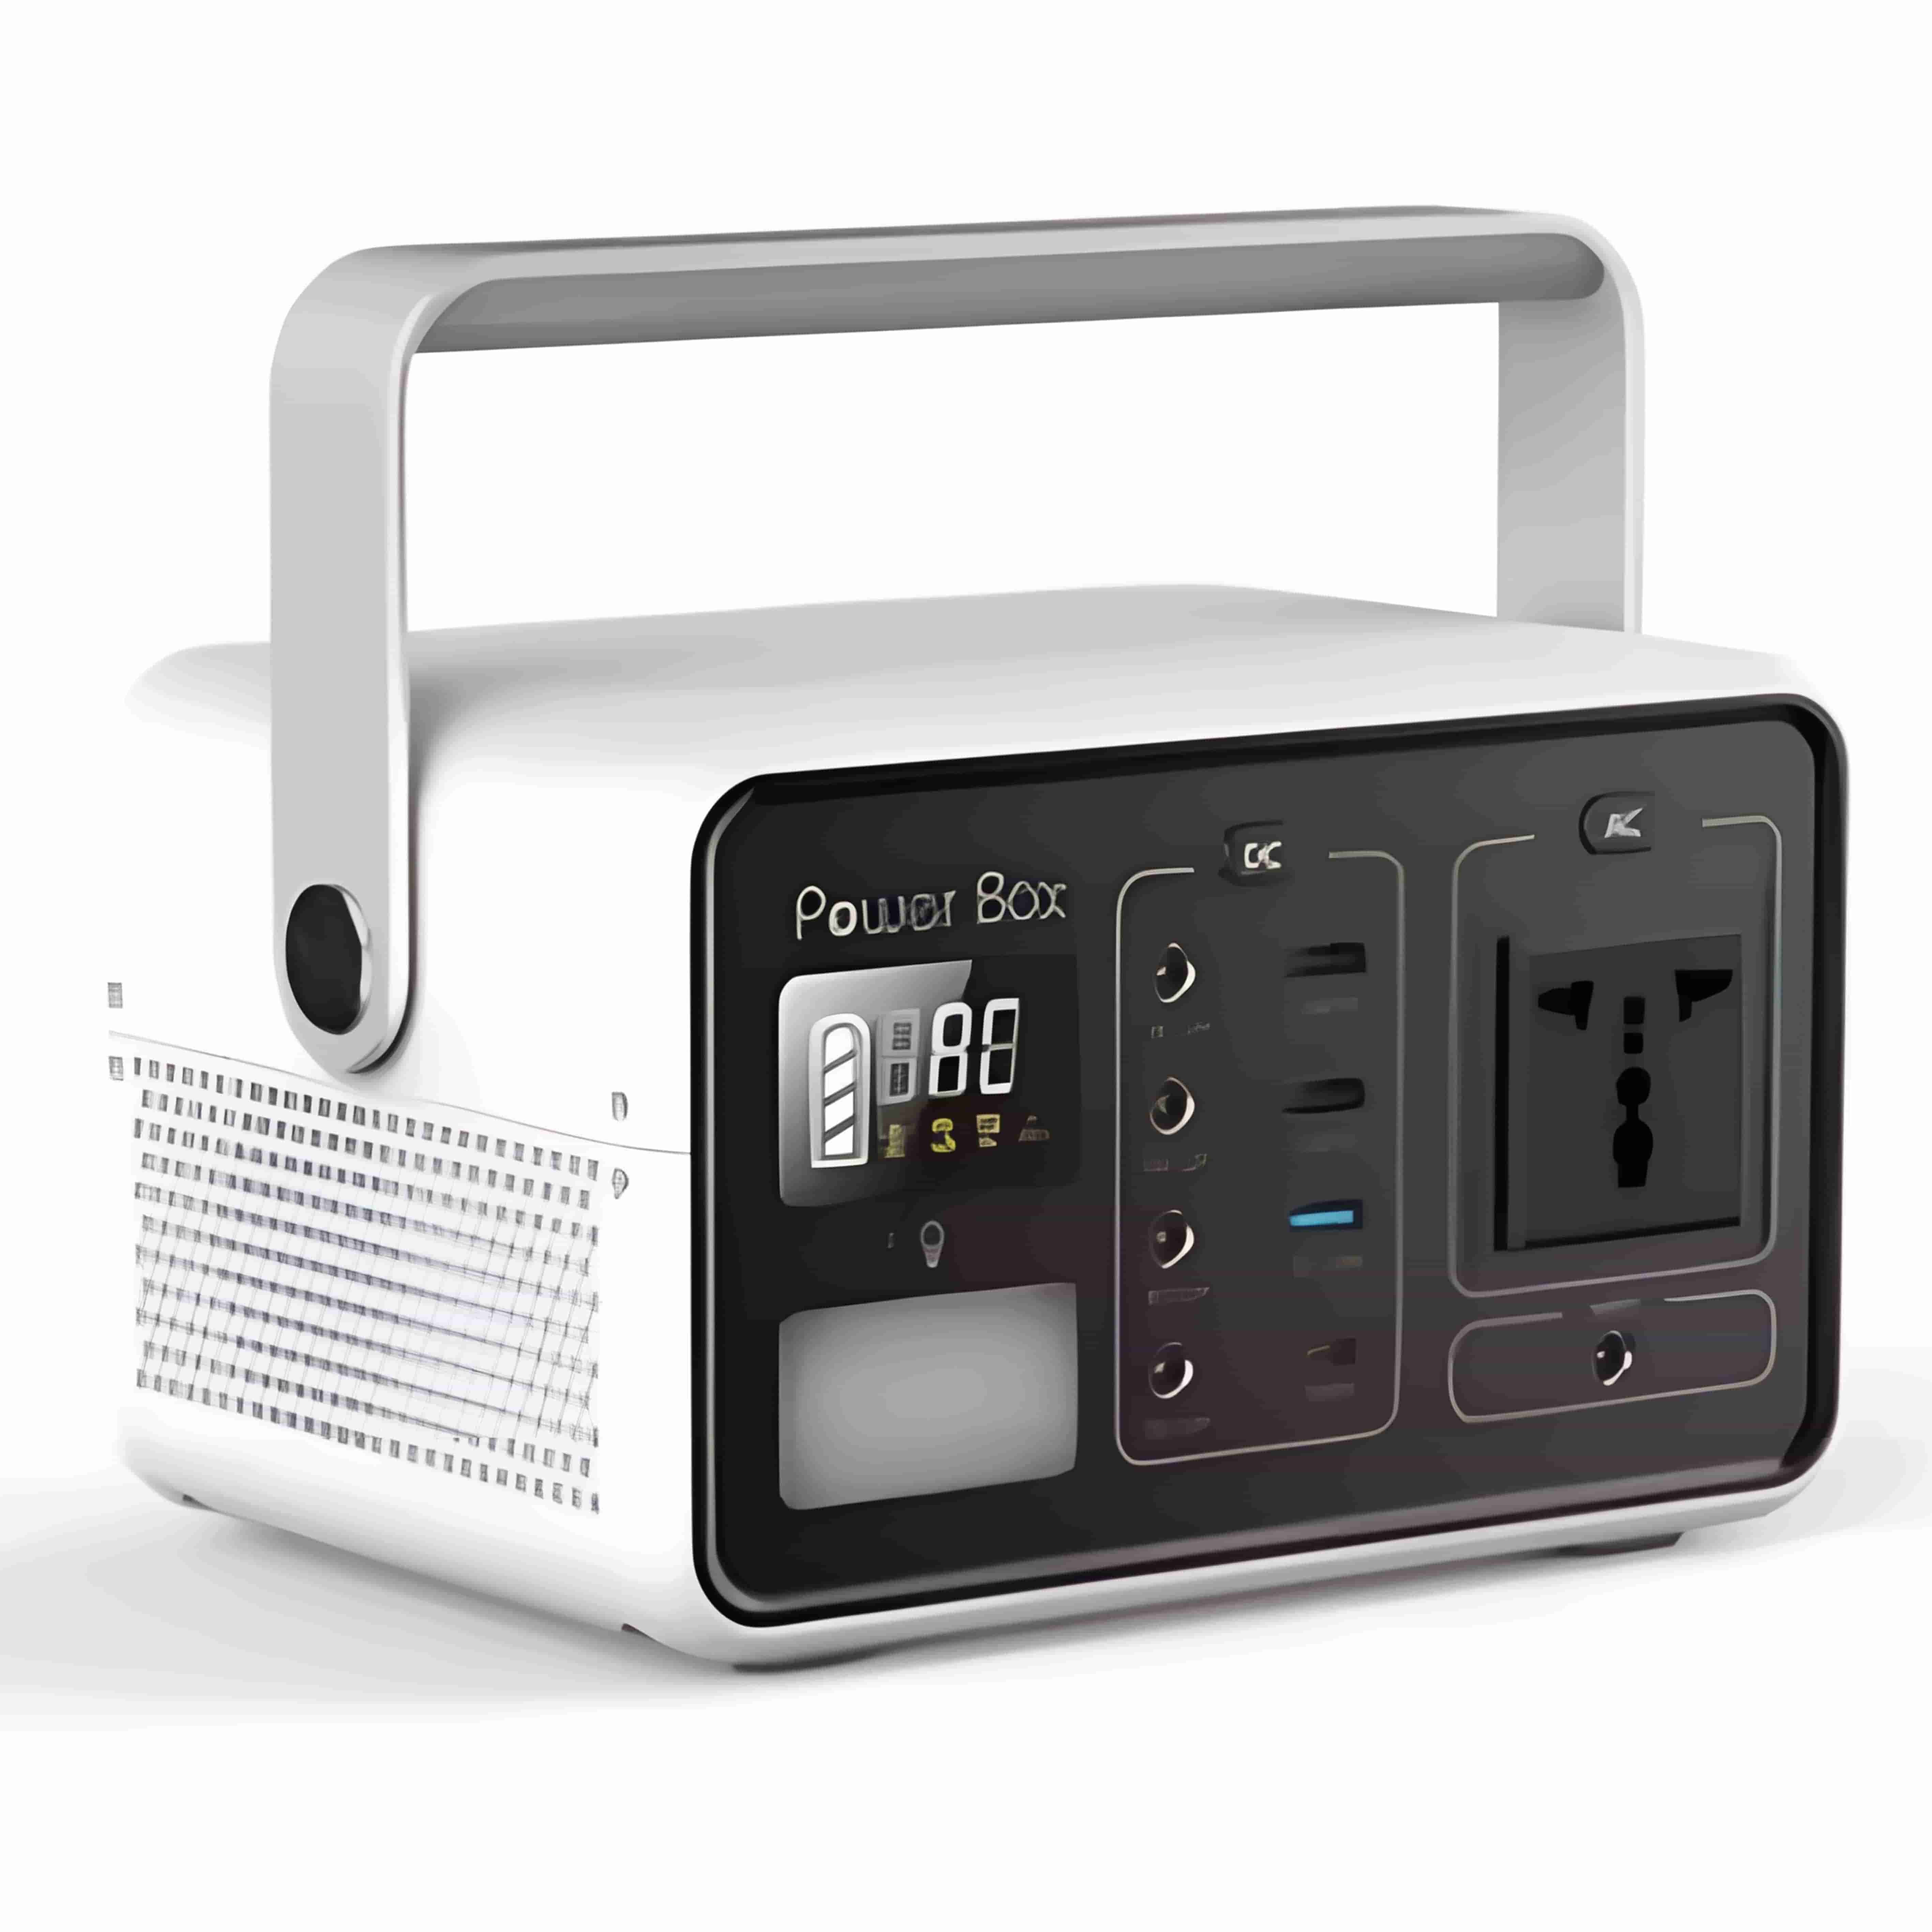
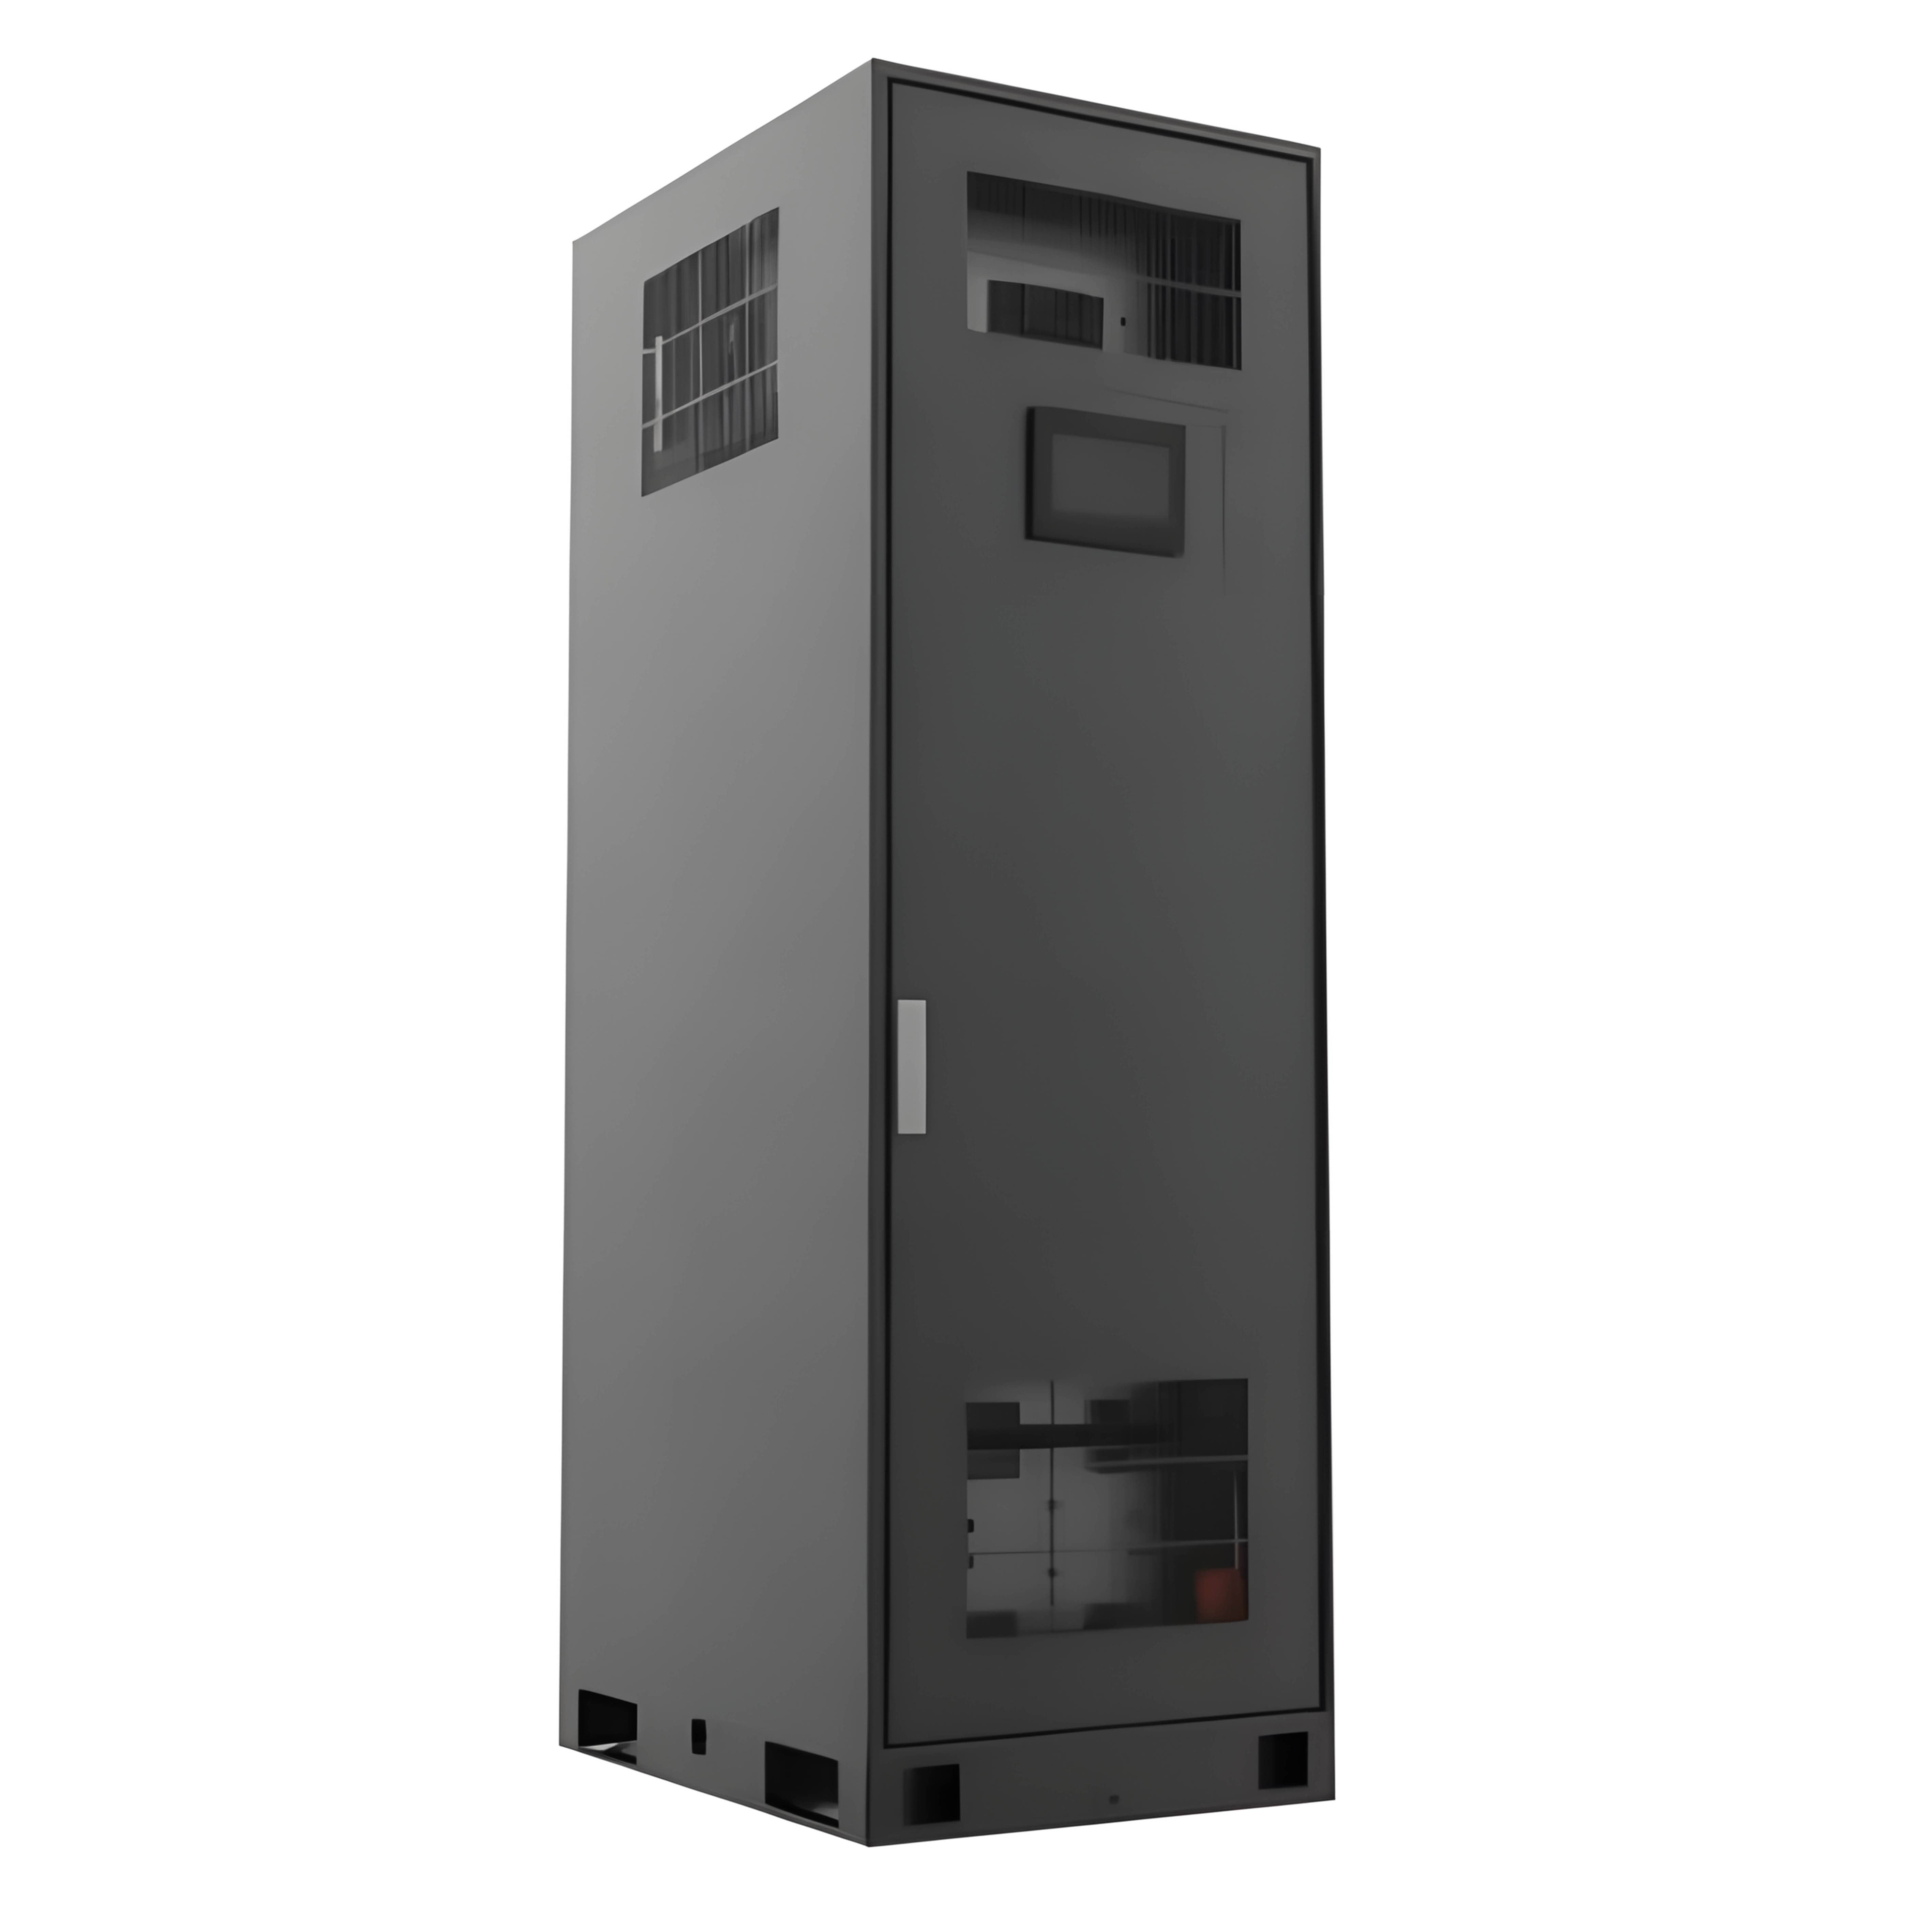
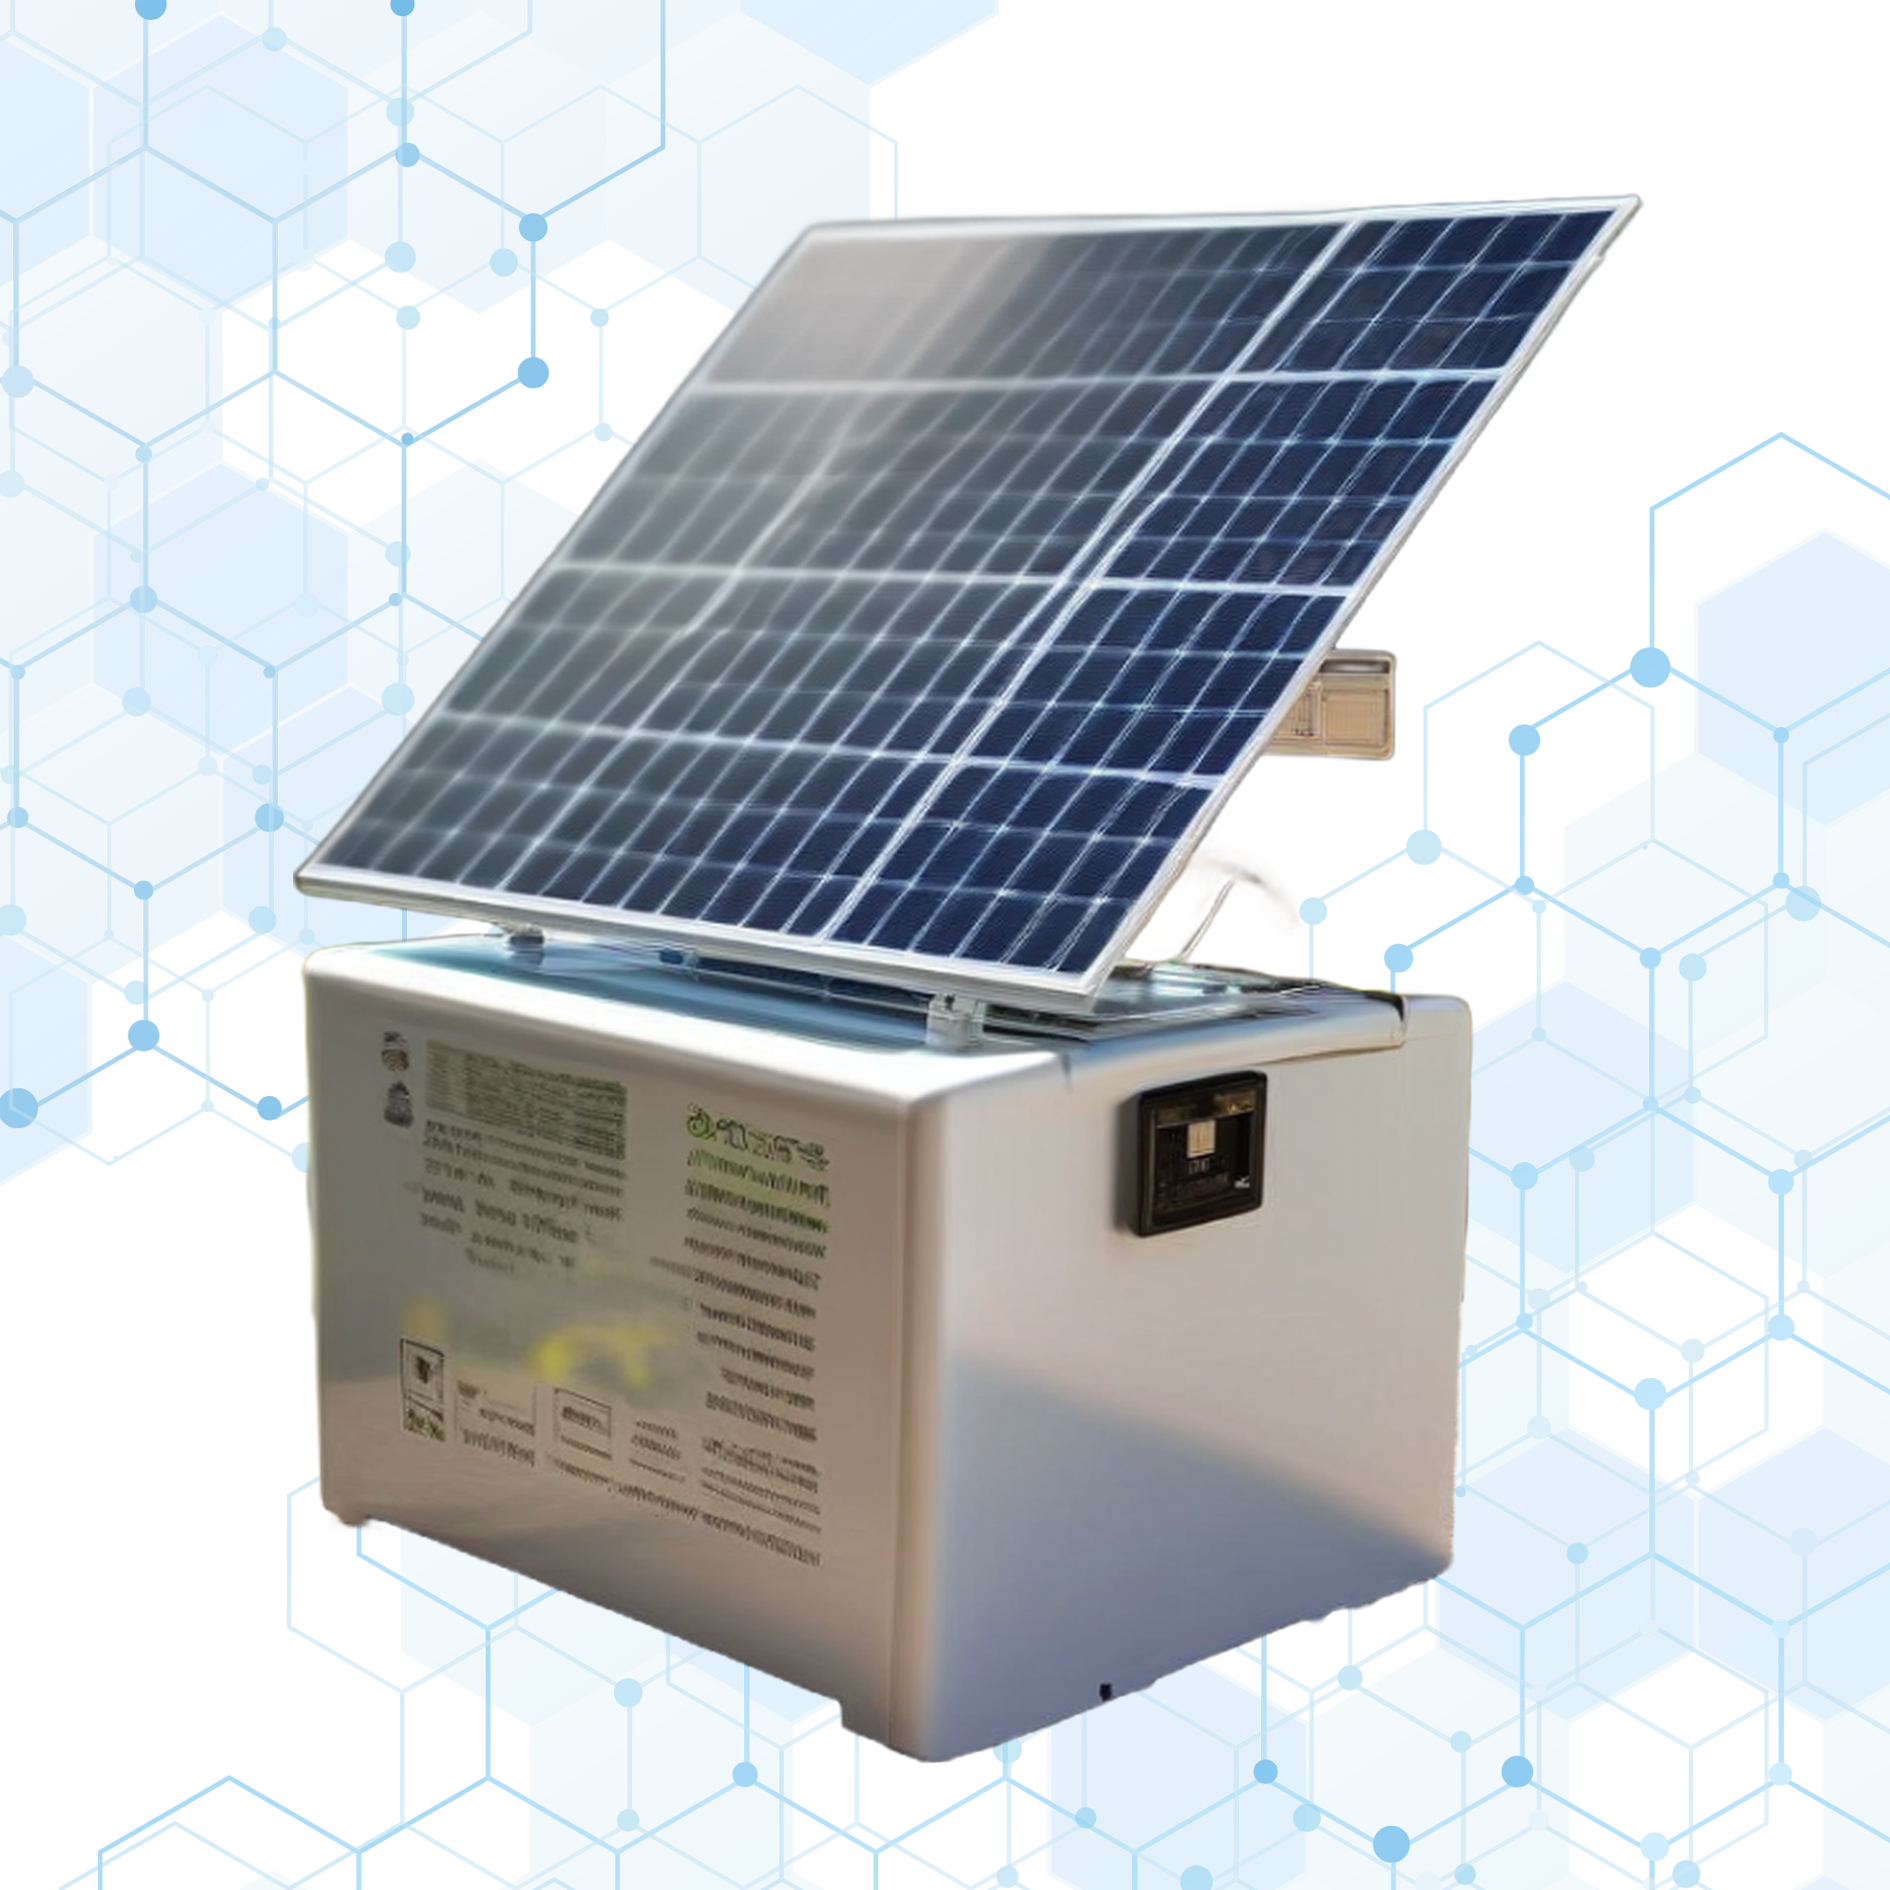
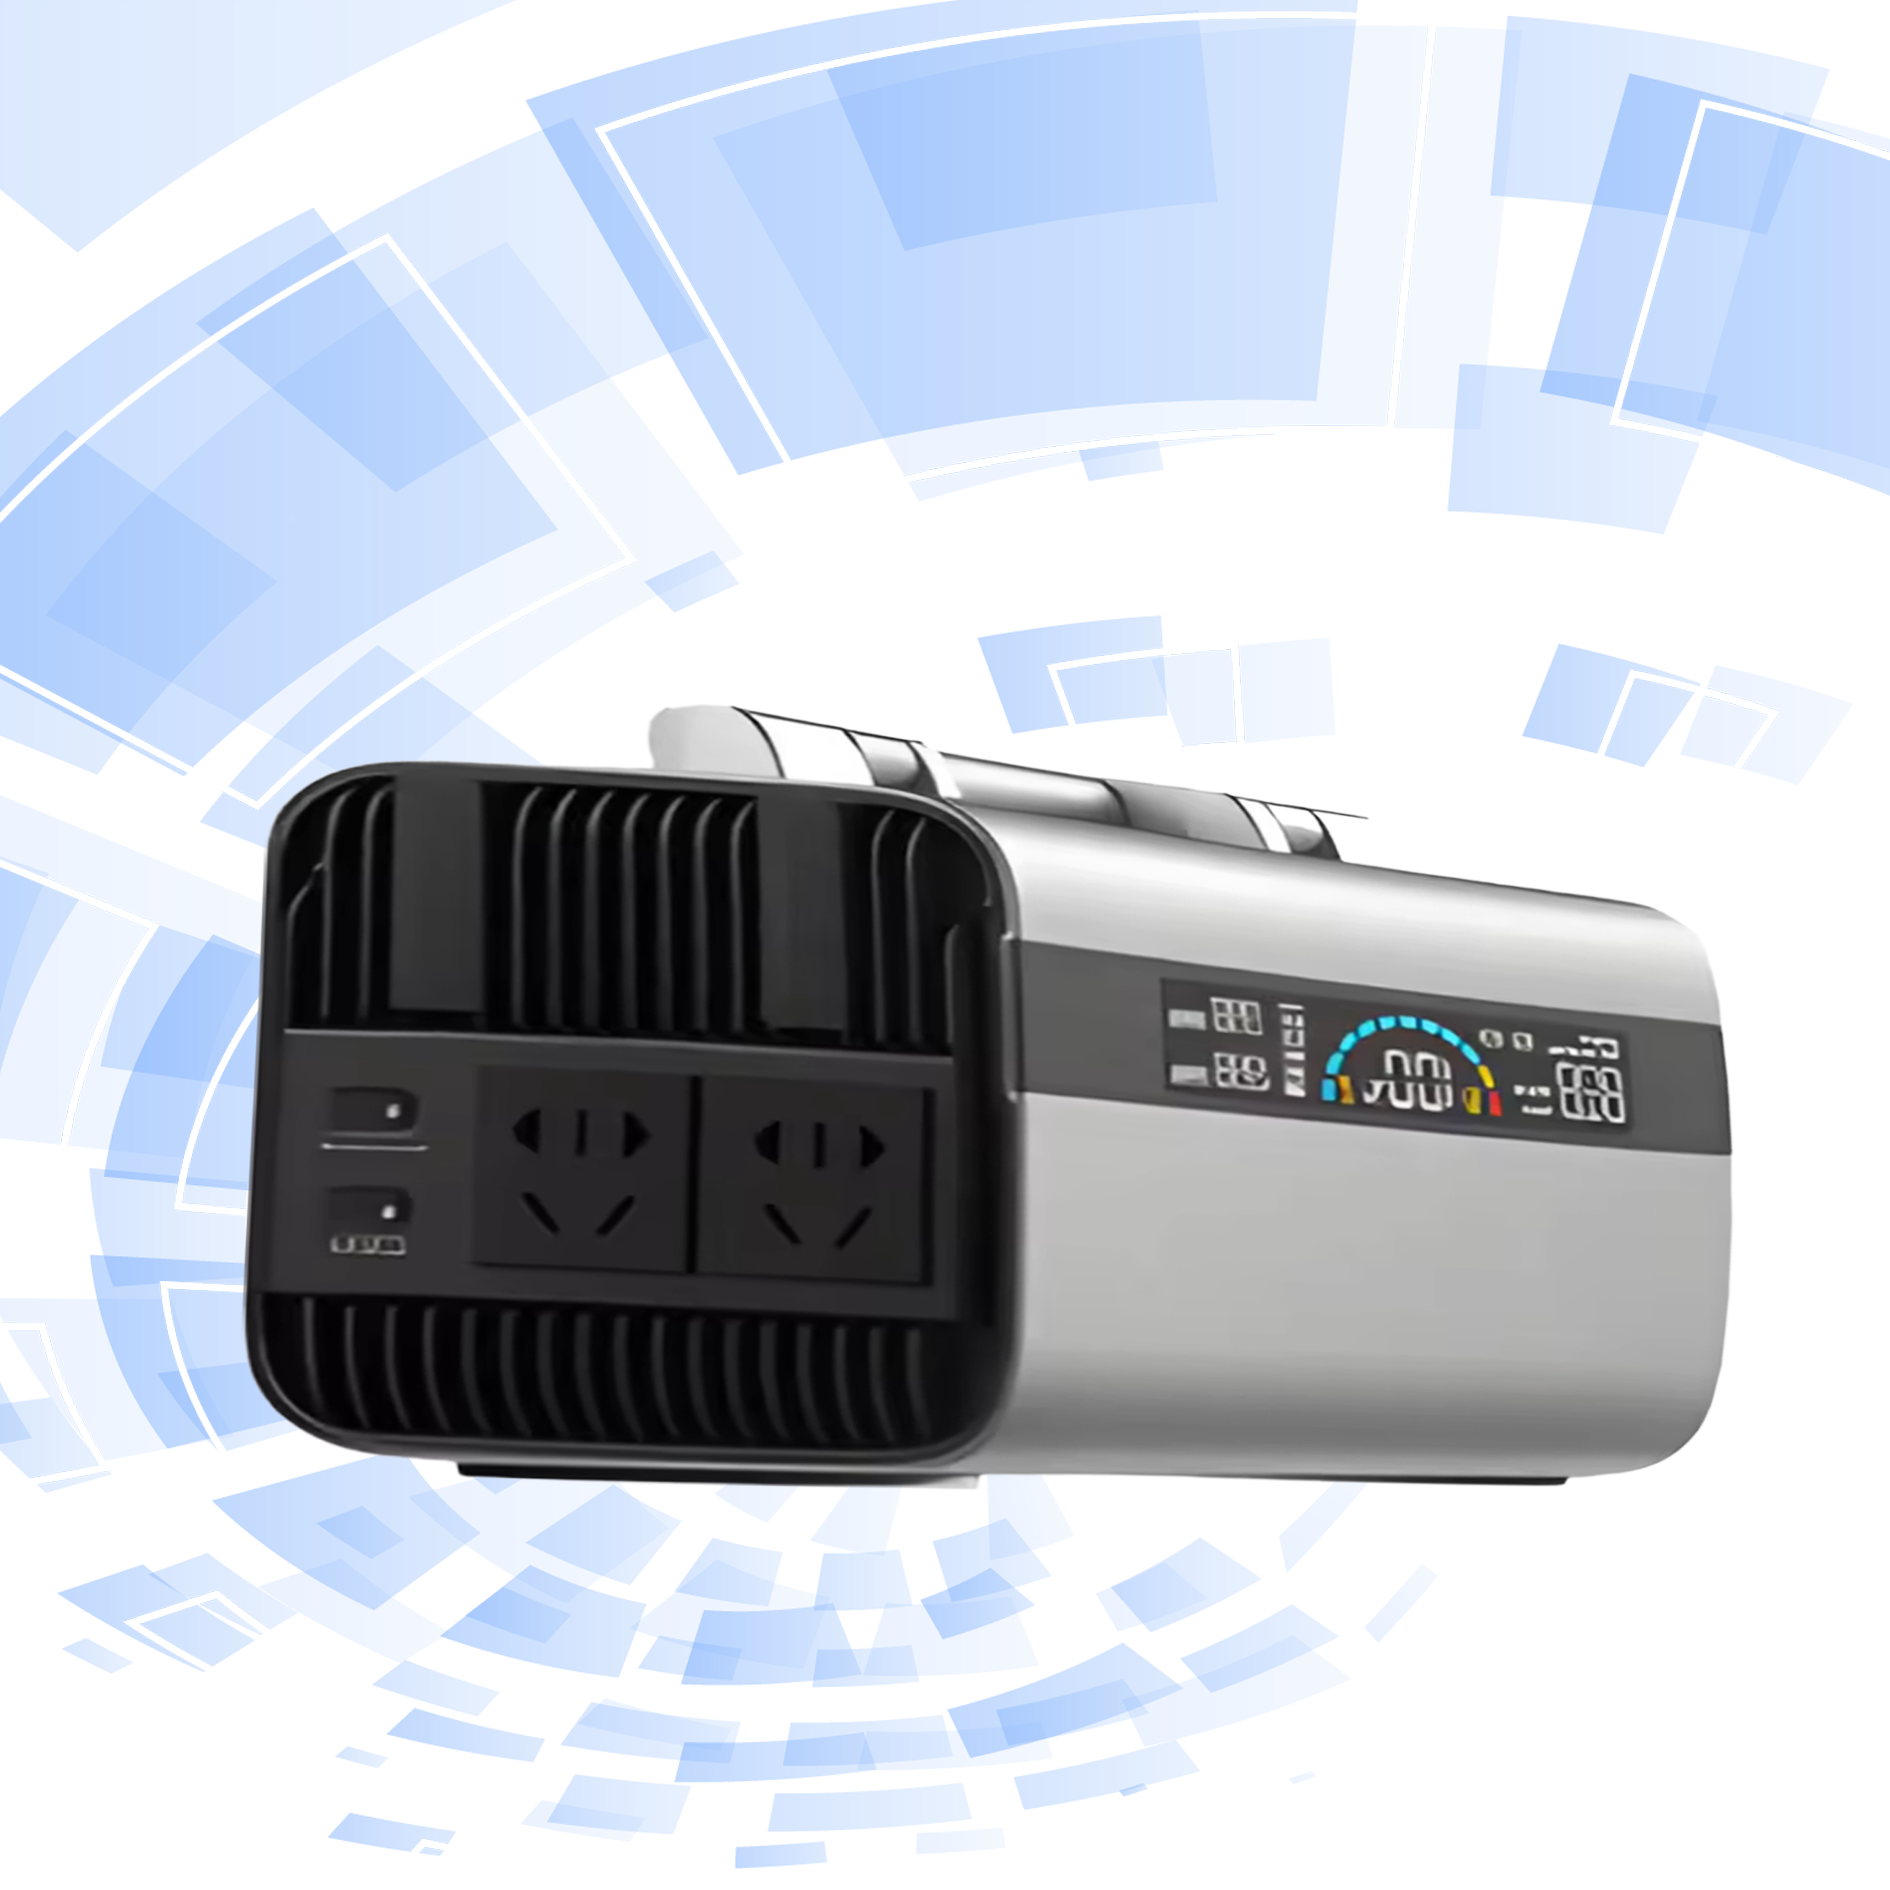
ঘরের জন্য সৌর শক্তি ব্যাটারি
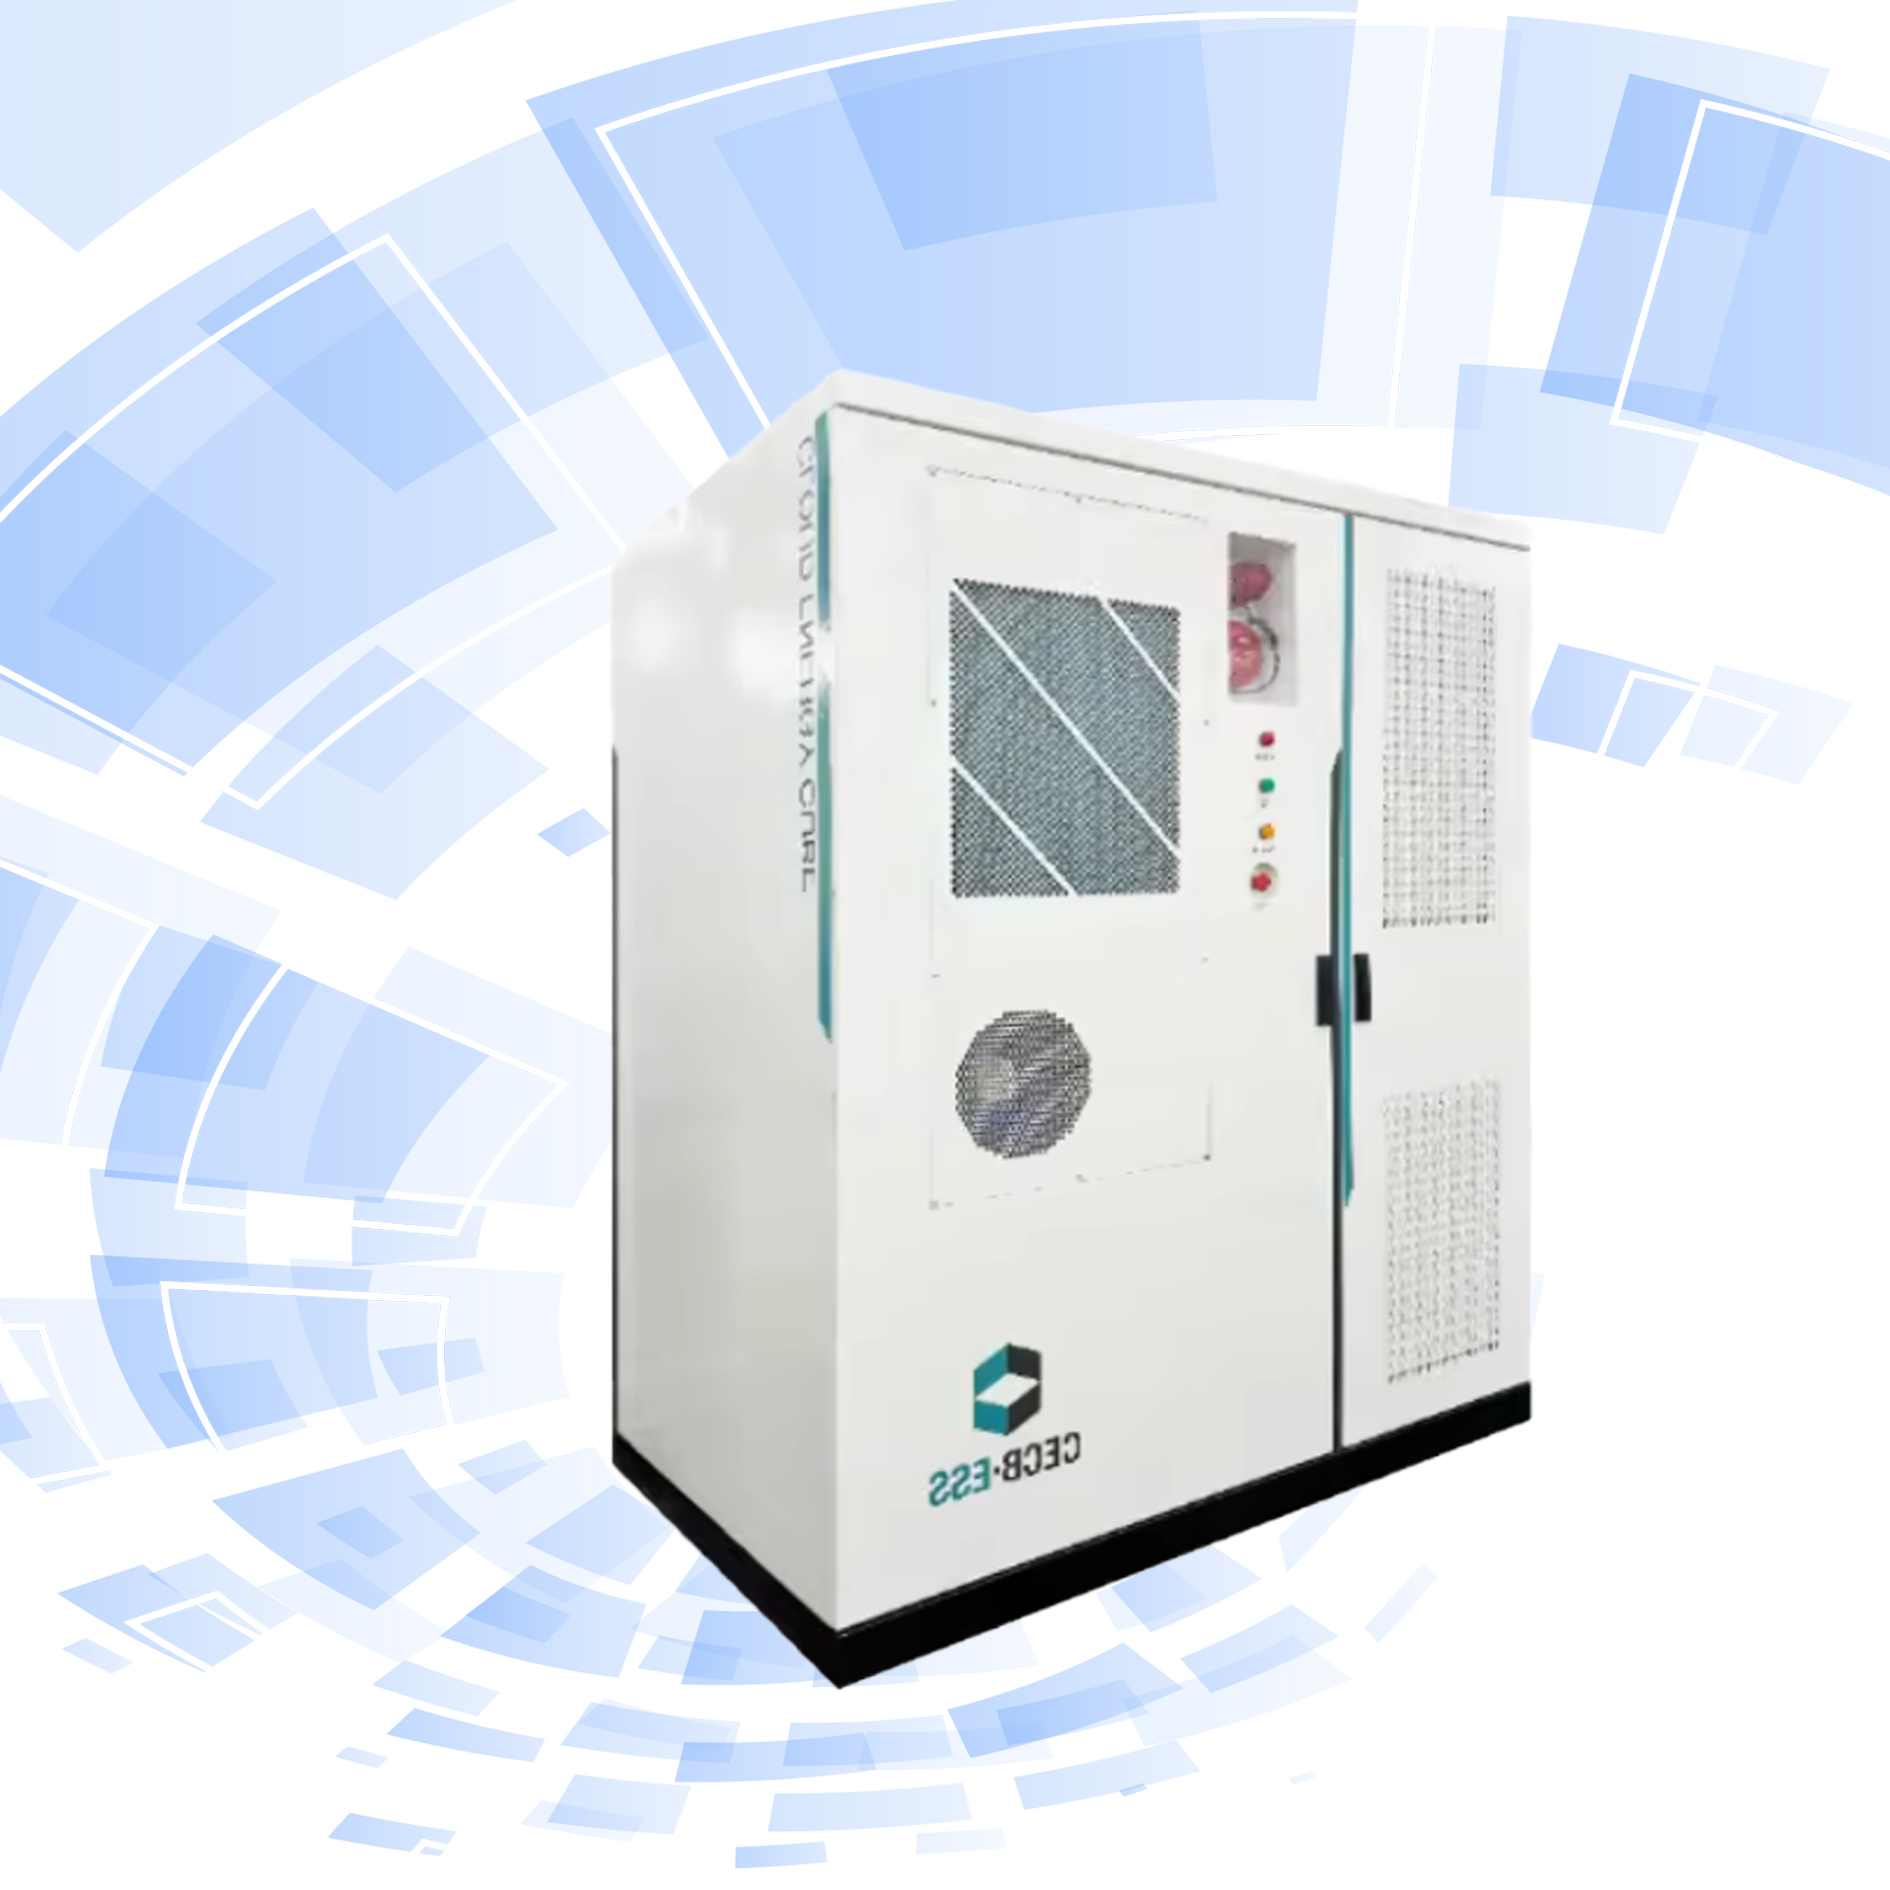
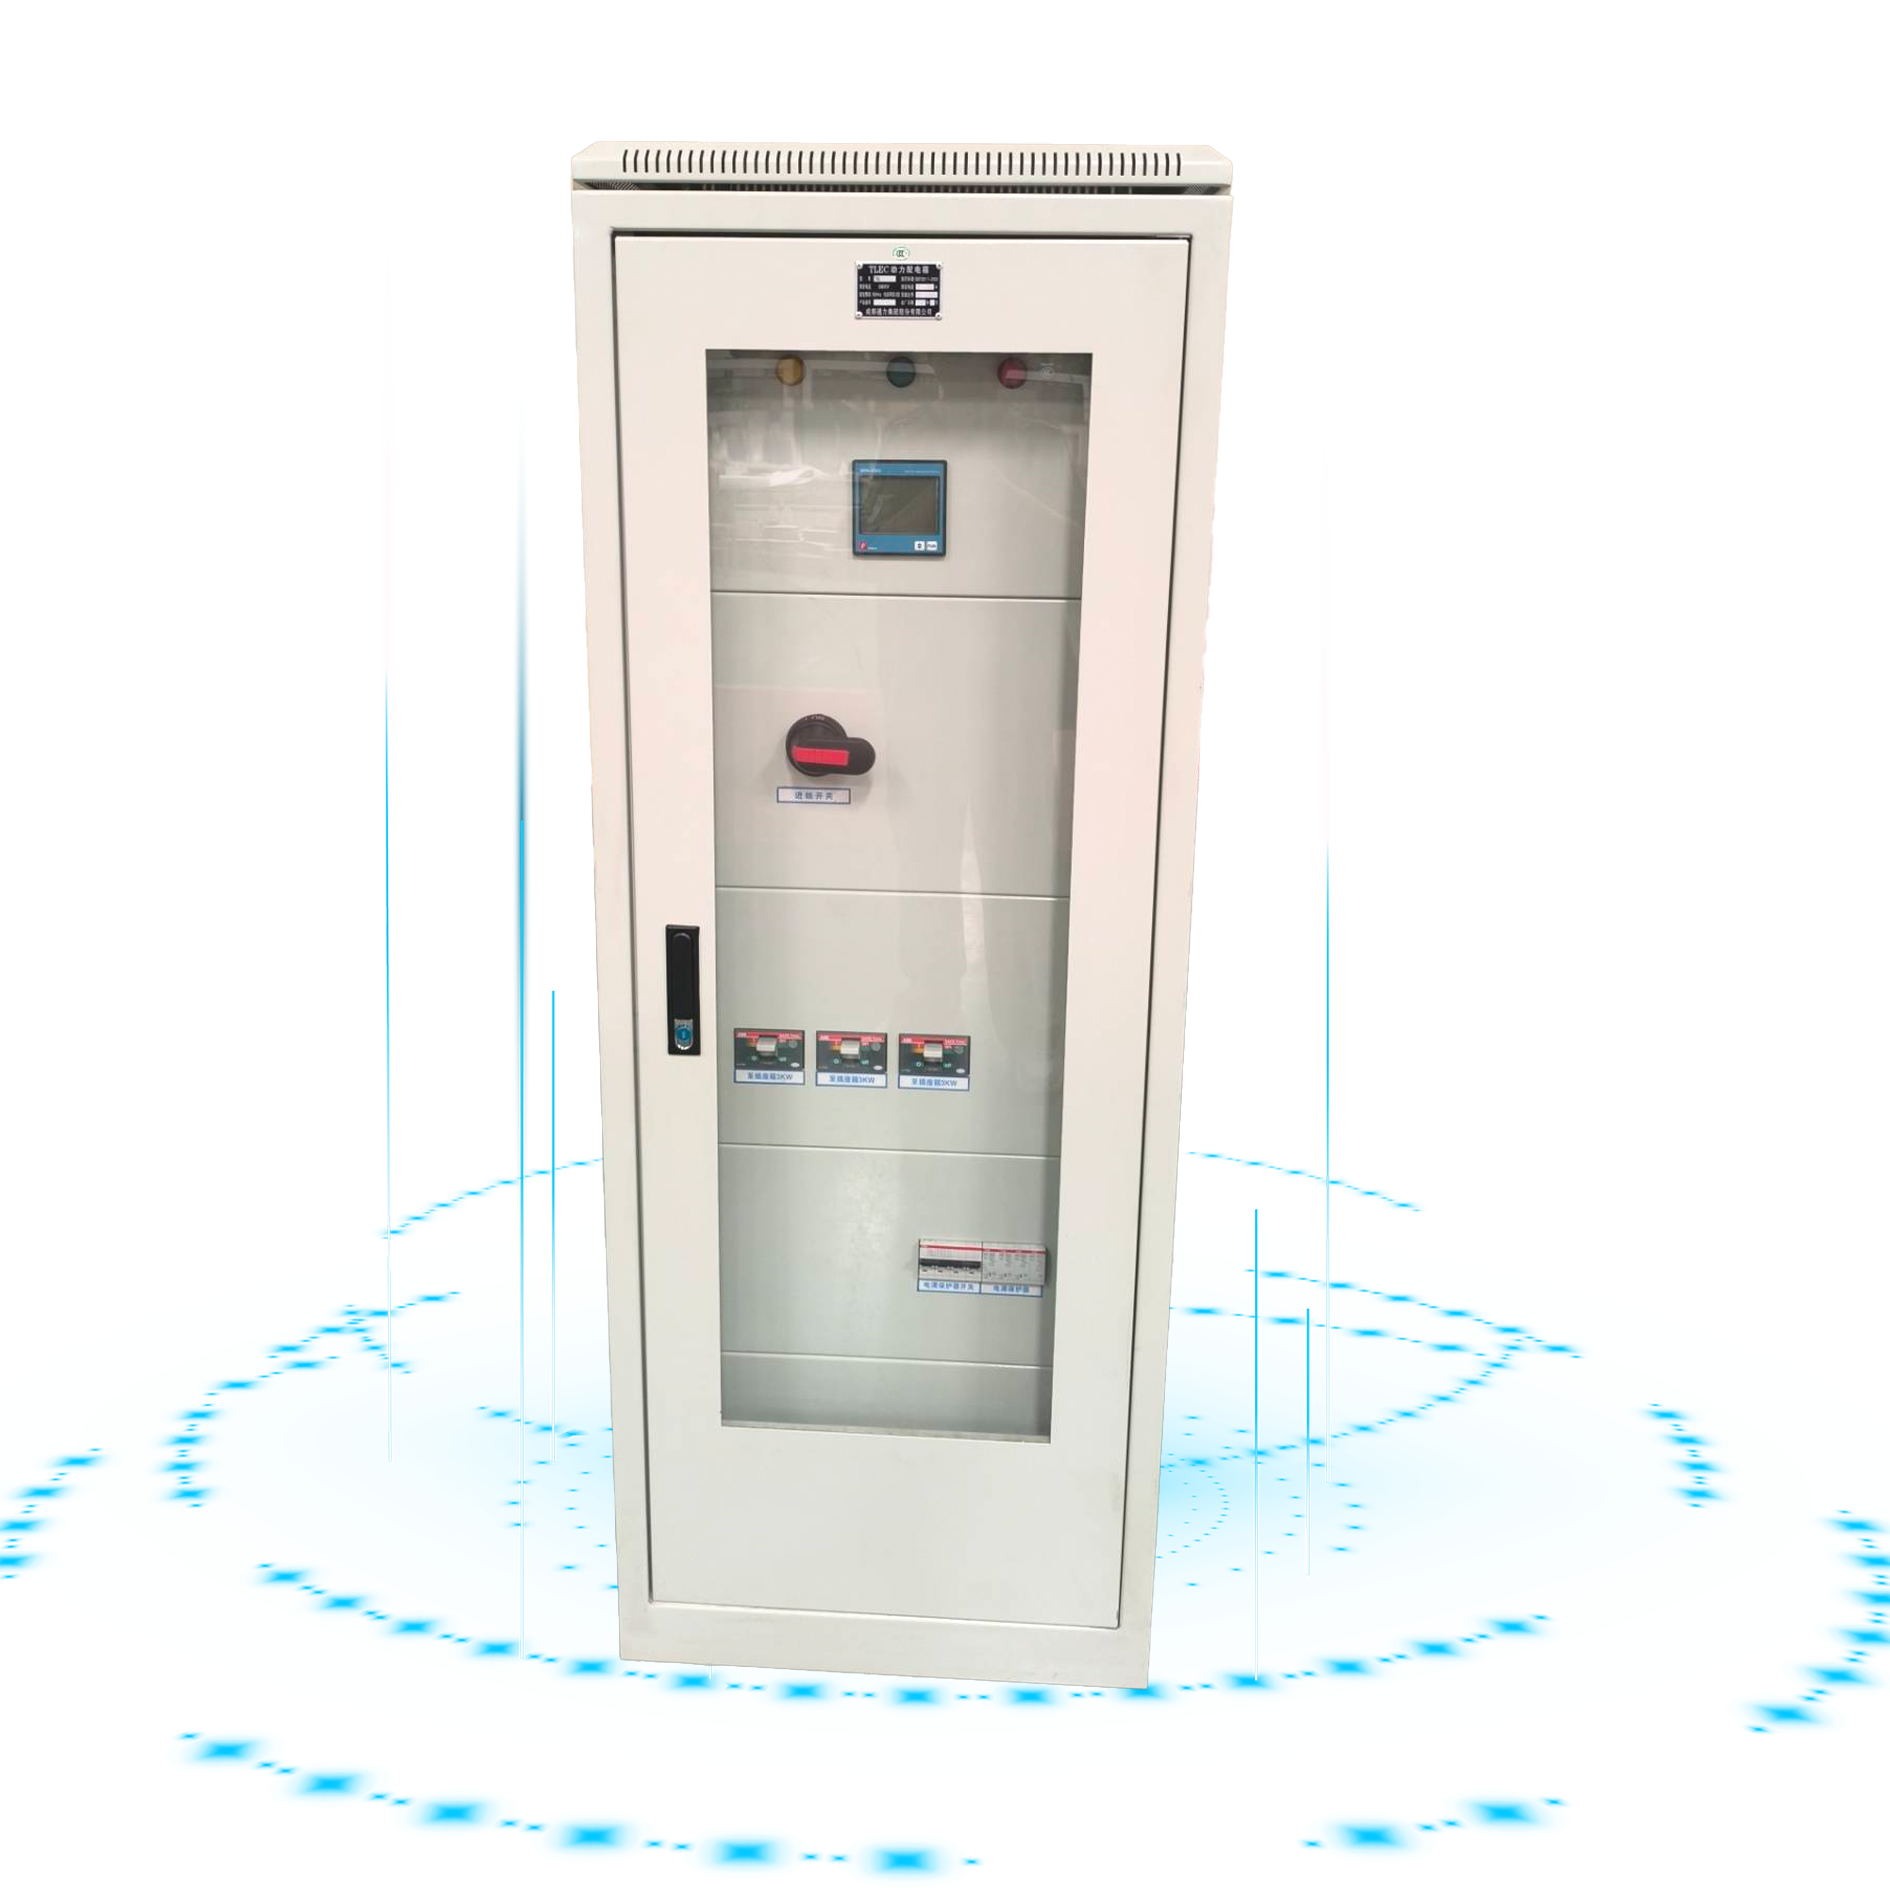
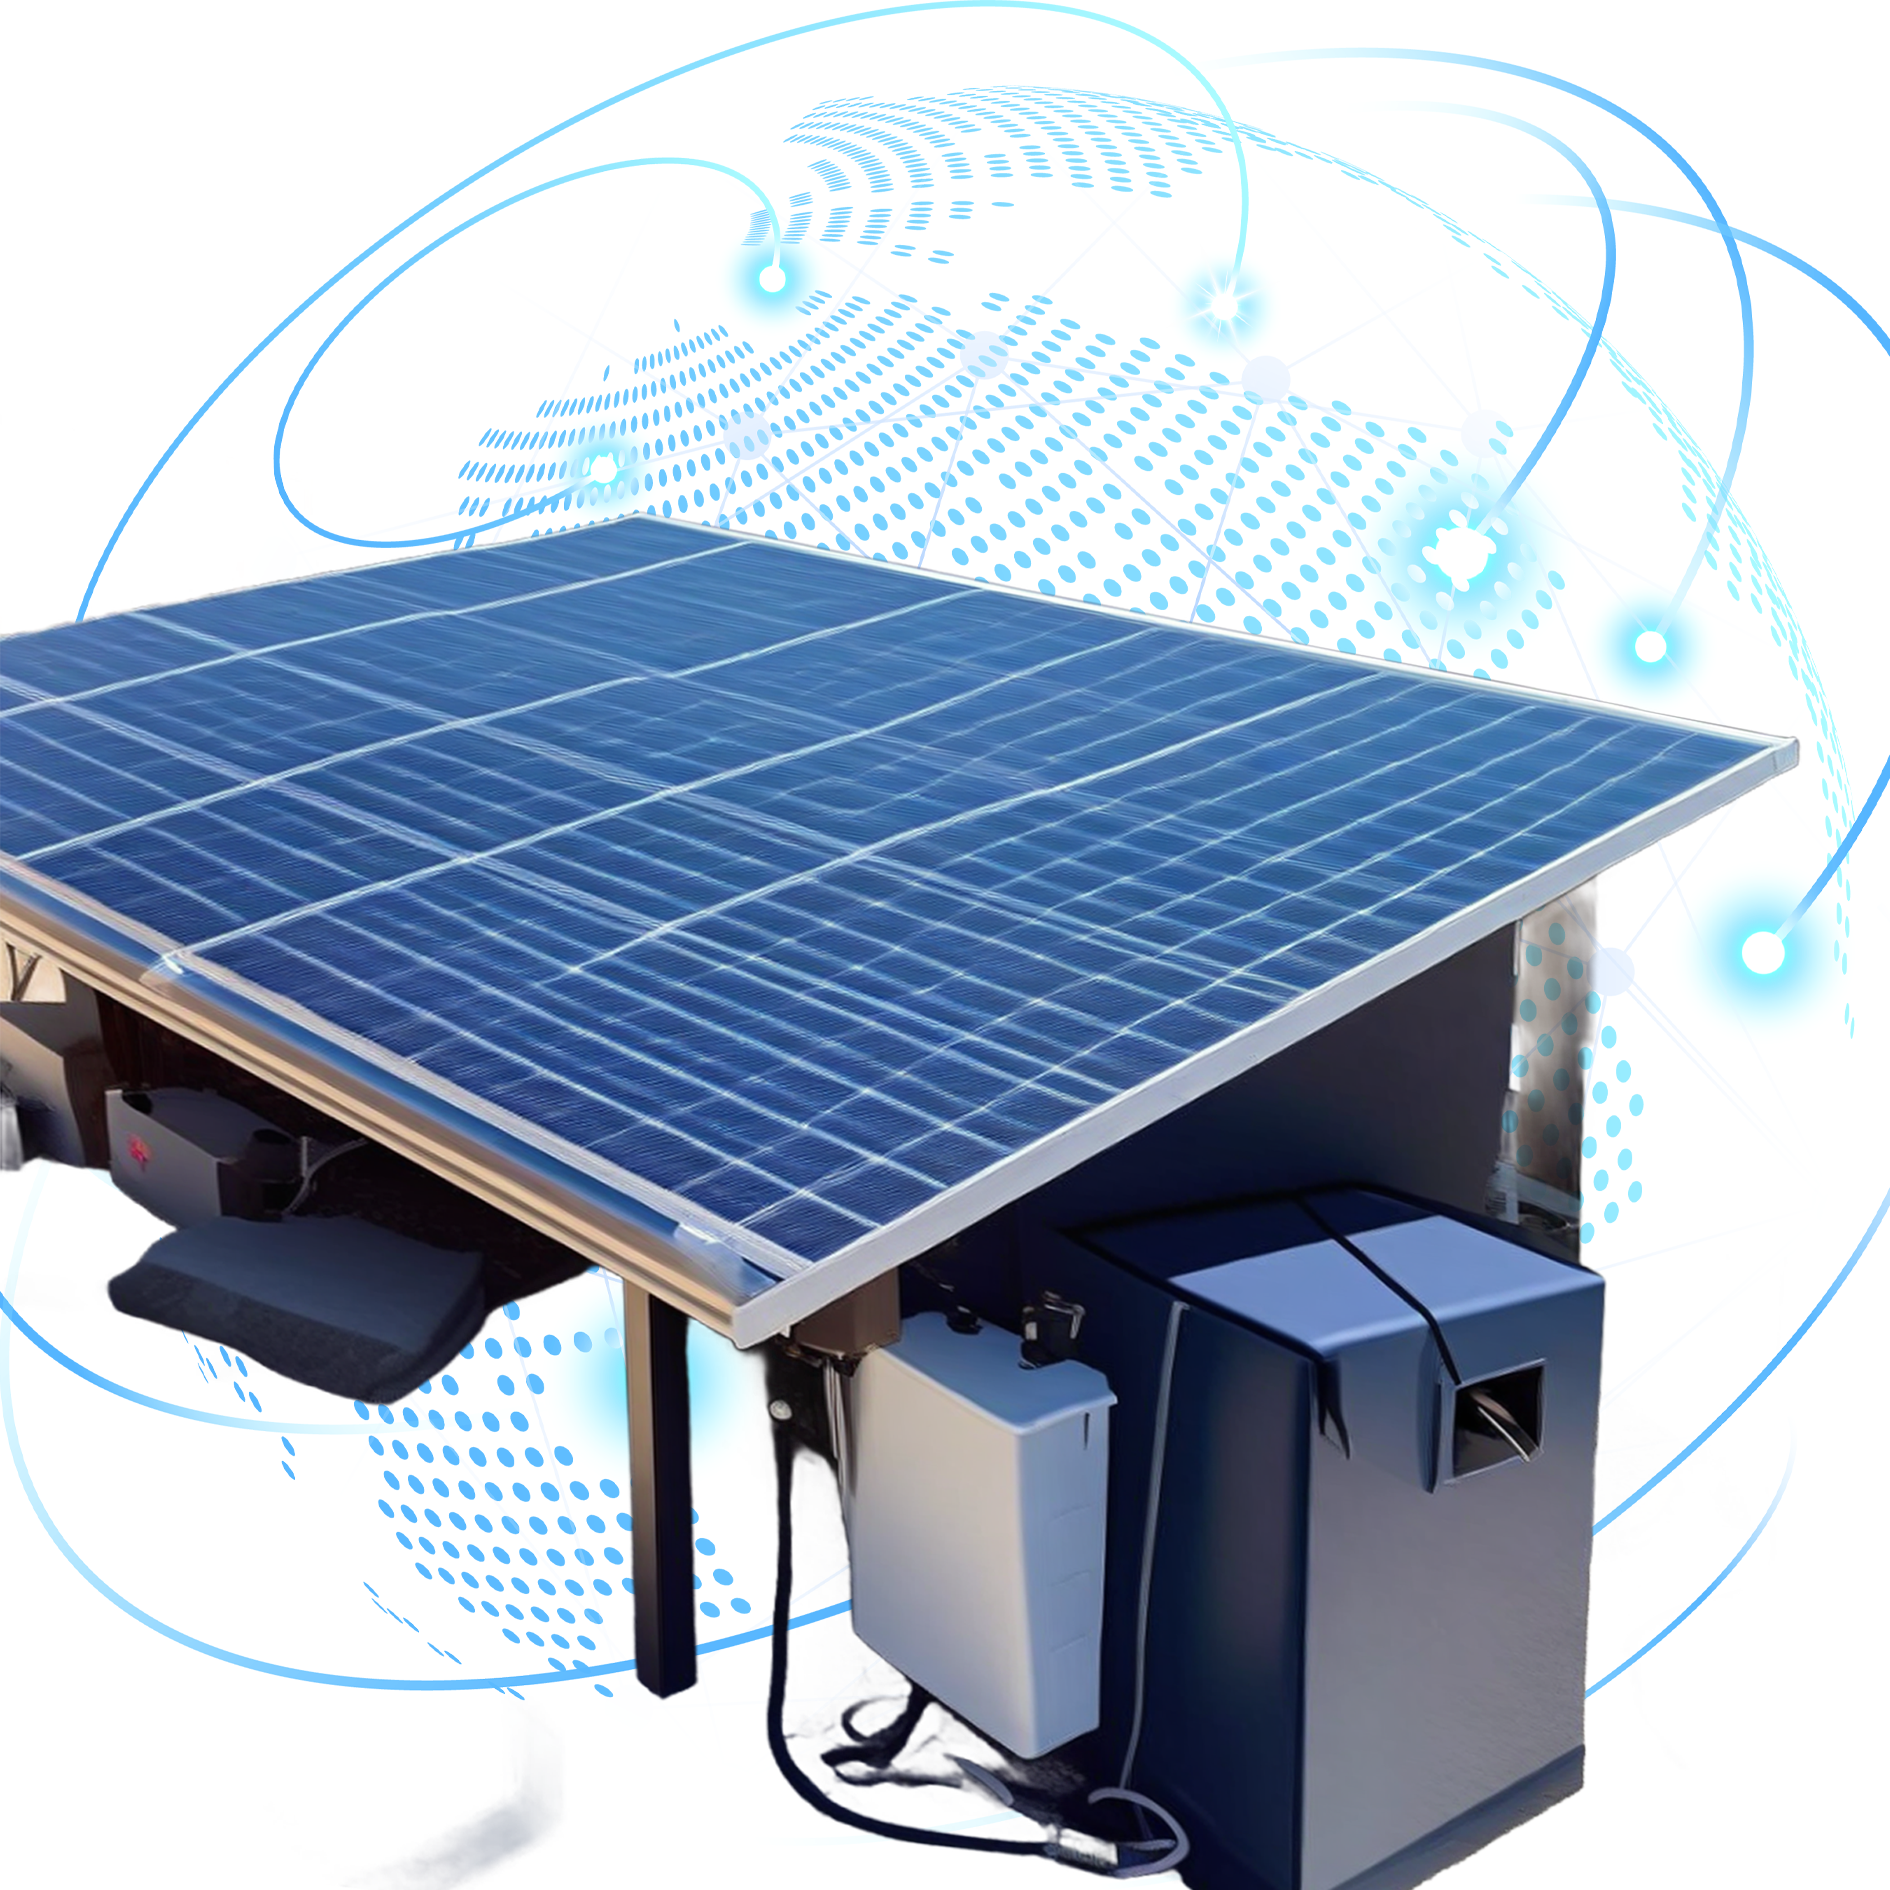
ঘরের জন্য সৌর শক্তি ব্যাটারি হল একটি বাড়িতে সৌর শক্তি পদ্ধতির অপরিহার্য উপাদান। এই ব্যাটারি দিনের ভিতর সৌর প্যানেল দ্বারা উৎপাদিত বিদ্যুৎ সঞ্চয় করে, যা রাতে বা সূর্যের আলো যথেষ্ট না থাকলে ব্যবহারের জন্য উপলব্ধ করে। এই ব্যাটারির মূল কাজগুলো অতিরিক্ত শক্তি সঞ্চয় করা, বিদ্যুৎ বিচ্ছেদের সময় পশ্চাত্তাপ শক্তি প্রদান করা এবং গ্রিডের উপর নির্ভরশীলতা কমানো। এই ব্যাটারির প্রযুক্তি বৈশিষ্ট্যসমূহ উচ্চ শক্তি ঘনত্ব, দীর্ঘ ডিসচার্জ সময় এবং ডিপ-সাইকেল ক্ষমতা অন্তর্ভুক্ত। এগুলো সাধারণত লিথিয়াম-আয়ন বা লিড-এসিড প্রযুক্তি ব্যবহার করে তৈরি হয়। ঘরের জন্য সৌর শক্তি ব্যাটারির প্রয়োগ ব্যাপকভাবে বিদ্যুৎ বিচ্ছেদের সময় প্রধান উপকরণগুলো চালানো, গ্রিড-ফ্রি জীবন সমর্থন করা এবং বিদ্যুৎ বিল কমানো অন্তর্ভুক্ত।

 EN
EN